![]()
Overview
The Hampton Roads Sanitation District (HRSD) provides wastewater treatment for 17 localities located in Southeastern Virginia. As part of their commitment to the environment they monitor water quality in the surrounding rivers and the Chesapeake Bay. HRSD wanted to be able to map the water quality to get a geographic representation of various water quality parameters in their service area. To perform this task they needed to be able to record not just the water quality parameters, but also the location of each reading along with the water depth at each reading. The system would be placed on a boat that would travel over the waterways continuously monitoring the water quality, depth and location of the boat.
Equipment
To record the location and depth of each sample a Garmin combination Depth Finder and GPS was selected. The GPS/Depth Finder outputs depth and location data via a RS-232 serial port in standard NMEA format. NMEA is a defined standard for communications between marine instrumentation. To record the water quality parameters a Sonde recording system was used. This is a battery powered device that is lowered into the water and outputs the desired water quality parameters via a RS-232 serial link. The Sonde reports the Temperature, Conductivity, Salinity, Dissolved Oxygen, PH, Turbidity, CHLA (Chlorophyll) and the status of the onboard batteries. A notebook PC running Windows XP was used to record and store the data.
Software
SDS used LabVIEW to develop the system software. LabVIEW is a graphical programming language from National Instruments that helps speed the development of test, measurement and automation systems.
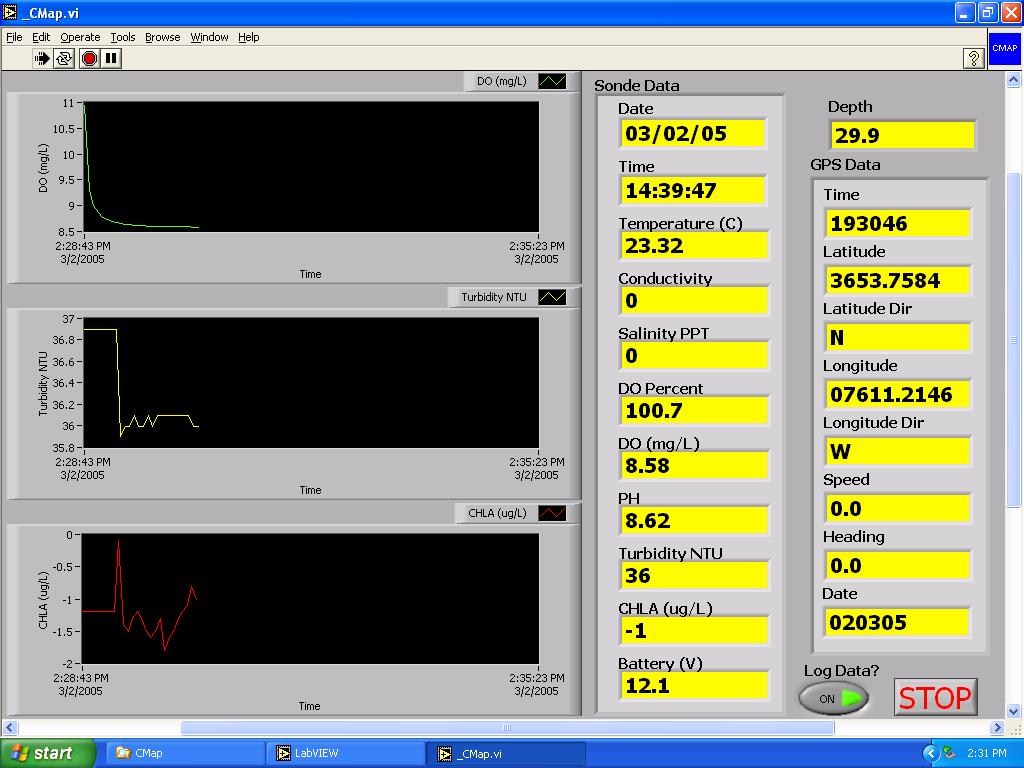
The software allows the user to select which ports the GPS and Sonde are connected to, the sample rate for collecting data and the data file for storing the data. The main screen displays all of the water quality data from the Sonde along with the GPS information and water depth. The system continuously updates this data. The data for Dissolved Oxygen, Turbidity and Chlorophyll are also displayed on continuously running on strip charts.
The data is saved in Excel compatible data files that can be read by the mapping software that will ultimately gather and display all the test data. Data saving is toggled on or off by a button on the main screen.
Project Timetable
When HRSD contacted SDS to develop the software for the system their timetable was basically 'we need it yesterday'. In order to speed up the development of the system SDS performed the software development on site along with the HRSD personnel providing their inputs regarding the required functionality. This teamwork approach allowed the system to be developed, installed on the boat and tested in a span of 3 days. Normally this process would take longer and detailed documents of the system requirements would be developed, however in this case these steps were bypassed in order to meet the customers needs. This allowed HRSD to meet important deadlines for gathering the water quality information.